The A* Inspector
Brief overview of the various settings in the A* inspector.
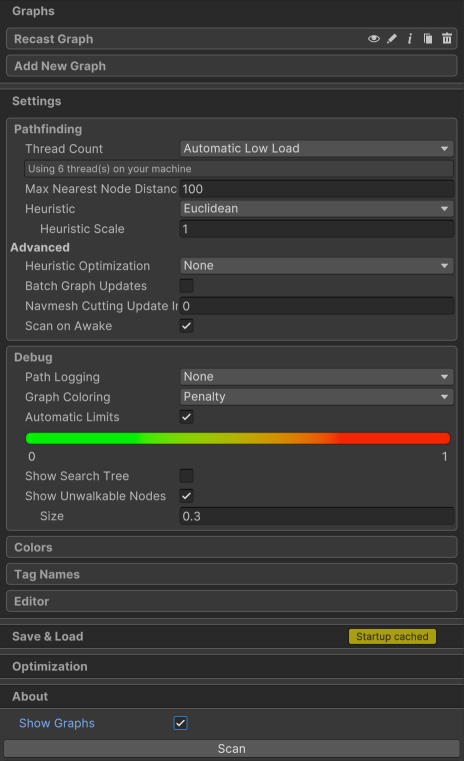
The inspector of the AstarPath component has 5 sections.
Graphs: holds a list of all graphs in the scene
Settings: various pathfinding and editor settings
Save & Load: allows you to save and load graphs from files
Optimization: various optimizations that can be applied to the system using compiler directives
About: info about which version you have and some links to the documentation
There is also the 'Show Graphs' toggle which enables or disables the graphs from being rendered in the scene view, and lastly there is the 'Scan' button which recalculates all graphs. In the editor, graphs are not scanned unless you press this button (or use the keyboard shortcut, see Keyboard Shortcuts).
Graphs

In the graphs tab, you can see all graphs that are in the current scene. You may have multiple graphs and they are all stored in the AstarPath component (you do not create multiple AstarPath components). If you click on the 'Add New Graph' button, you will see a list of all graph types that you can create.
There are several graph types available in the package. Grids, manually created navmeshes, automatically created navmeshes (called recast graphs), point graphs, and you can even write your own custom graph types.
Next to each graph there are 5 icons. 
They are:
eye: Shows or hides the graph from being rendered in the scene view. When the graph is hidden, this icon will turn red.
pen: Click on the pen to rename the graph. This can be very useful if you have many graphs and it is becoming hard to keep track of which one is which.
i: Clicking on the 'i' shows some information about how many nodes there are in the graph. Note that you must scan the graph for it to show anything relevant.
duplicate: Duplicates the graph. This can be useful if you want to have two graphs with only slightly different settings.
trash can: Deletes the graph.
Take a look at each graph's respective documentation for more info about their settings.
Settings

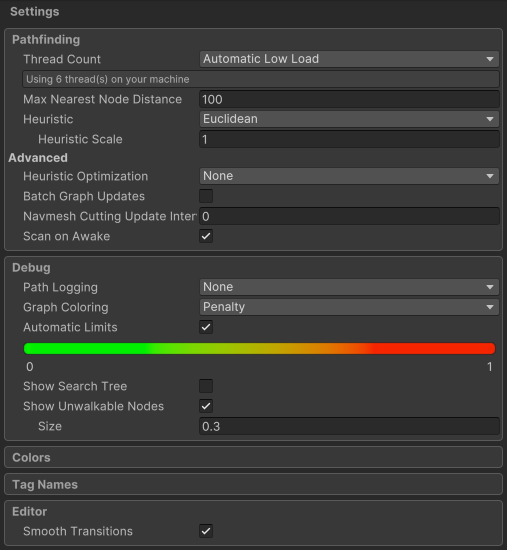
This section contains all global pathfinding and logging settings. Here you can you can for example set the number of threads to use for pathfinding (note that this is only for pathfinding, when graphs are scanned, they typically use the unity job system, which uses all cores of the machine). Or you can tweak the logging settings to get more information about what the system is doing.
Pathfinding
Multithreading puts pathfinding in another thread, this is great for performance on 2+ core computers since the framerate will barely be affected by the pathfinding at all.
None indicates that the pathfinding is run in the Unity thread as a coroutine
Automatic will try to adjust the number of threads to the number of cores and memory on the computer. Less than 512mb of memory or a single core computer will make it revert to using no multithreading.
It is recommended that you use one of the "Auto" settings that are available. The reason is that even if your computer might be beefy and have 8 cores. Other computers might only be quad core or dual core in which case they will not benefit from more than 1 or 3 threads respectively (you usually want to leave one core for the unity thread). If you use more threads than the number of cores on the computer it is mostly just wasting memory, it will not run any faster. The extra memory usage is not trivially small. Each thread needs to keep a small amount of data for each node in all the graphs. It is not the full graph data but it is proportional to the number of nodes. The automatic settings will inspect the machine it is running on and use that to determine the number of threads so that no memory is wasted.
The exception is if you only have one (or maybe two characters) active at time. Then you should probably just go with one thread always since it is very unlikely that you will need the extra throughput given by more threads. Keep in mind that more threads primarily increases throughput by calculating different paths on different threads, it will not calculate individual paths any faster.
WarningIf you are modifying the pathfinding core scripts or if you are directly modifying graph data without using any of the safe wrappers (like AddWorkItem), multithreading can cause strange errors and cause pathfinding to stop working if you are not careful.
NoteWebGL does not support threads at all (since javascript is single-threaded) so no threads will be used on that platform.
This setting only applies to pathfinding. Graph updates use the Unity Job System, which uses a different thread pool.
A* Pro FeatureThis is an A* Pathfinding Project Pro feature only. This function/class/variable might not exist in the Free version of the A* Pathfinding Project or the functionality might be limited.
The Pro version can be bought here
When searching for the nearest node to a point, this is the limit (in world units) for how far away it is allowed to be.
This is relevant if you try to request a path to a point that cannot be reached and it thus has to search for the closest node to that point which can be reached (which might be far away). If it cannot find a node within this distance then the path will fail.

The heuristic, often referred to as just 'H' is the estimated cost from a node to the target. Different heuristics affect how the path picks which one to follow from multiple possible with the same length
WarningReducing the heuristic scale below 1, or disabling the heuristic, can significantly increase the cpu cost for pathfinding, especially for large graphs.
If a value lower than 1 is used, the pathfinder will search more nodes (slower). If 0 is used, the pathfinding algorithm will be reduced to dijkstra's algorithm. This is equivalent to setting heuristic to None. If a value larger than 1 is used the pathfinding will (usually) be faster because it expands fewer nodes, but the paths may no longer be the optimal (i.e the shortest possible paths).
Usually you should leave this to the default value of 1.
WarningReducing the heuristic scale below 1, or disabling the heuristic, can significantly increase the cpu cost for pathfinding, especially for large graphs.
Advanced
Seeheuristic-opt
Game AI Pro - Pathfinding Architecture Optimizations by Steve Rabin and Nathan R. Sturtevant
If toggled, graph updates will batched and executed less often (specified by graphUpdateBatchingInterval).
This can have a positive impact on pathfinding throughput since the pathfinding threads do not need to be stopped as often, and it reduces the overhead per graph update. All graph updates are still applied, they are just batched together so that more of them are applied at the same time.
Do not use this if you want minimal latency between a graph update being requested and it being applied.
This only applies to graph updates requested using the UpdateGraphs method. Not those requested using AddWorkItem.
If you want to apply graph updates immediately at some point, you can call FlushGraphUpdates.
If batchGraphUpdates is true, this defines the minimum number of seconds between each batch of graph updates.
This can have a positive impact on pathfinding throughput since the pathfinding threads do not need to be stopped as often, and it reduces the overhead per graph update. All graph updates are still applied however, they are just batched together so that more of them are applied at the same time.
Do not use this if you want minimal latency between a graph update being requested and it being applied.
This only applies to graph updates requested using the UpdateGraphs method. Not those requested using AddWorkItem.
If you disable this, you will have to call AstarPath.active.Scan yourself to enable pathfinding. Alternatively you could load a saved graph from a file.
If a startup cache has been generated (see Saving and Loading Graphs), it always takes priority, and the graphs will be loaded from the cache instead of scanned.
This can be useful to disable if you want to scan your graphs asynchronously, or if you have a procedural world which has not been created yet at the start of the game.
Debug
Use less debugging to improve performance (a bit) or just to get rid of the Console spamming. Use more debugging (heavy) if you want more information about what the pathfinding scripts are doing. The InGame option will display the latest path log using in-game GUI.

NoteOnly relevant in the editor
This will show the search tree for the latest path.
NoteOnly relevant in the editor
NoteOnly relevant in the editor
Colors
Here you can set the colors to be used in the scene view to visualize the graphs.
Here you can set the names of all tags.
Editor
Save & Load

This section allows you to save and load graphs to and from files.
Typically, the graphs will be scanned when the game starts. But if you have a large world, this may take some time. In that case, you can cache the scanned graph, so that it becomes much faster to load.
Optimization

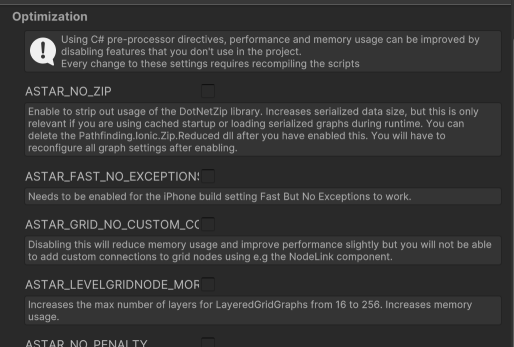
This section contains various features that can be enabled or disabled project-wide, using compiler directives.
You typically do not have to touch these at all. But they can in some cases give you small performance or memory improvements.
About

This section shows the current version and links to the documentation.
NoteThis always links to the latest non-beta documentation; however, you can find the documentation for older versions or beta releases by clicking on the 'Show Older Versions' button on the download page: https://www.arongranberg.com/astar/download
Show Graphs
This toggle, at the bottom of the inspector, enables or disables the graphs from being rendered in the scene view.
Scan button
The scan button at the bottom of the inspector is used to calculate the graphs based on their settings and the world.
When editing settings in the inspector, it's handy to know that there's also a shortcut for scanning the graphs: Cmd+Alt+S (mac) or Ctrl+Alt+S (windows).
The graphs will also be scanned automatically when the game starts, by default.


![]()
