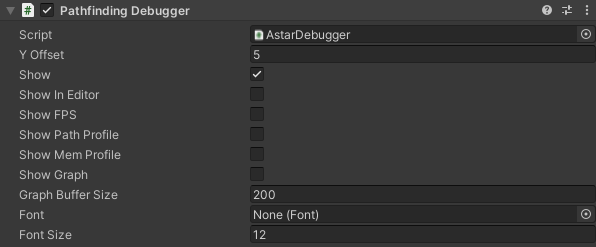
Class AstarDebugger Extends VersionedMonoBehaviour
Debugger for the A* Pathfinding Project.

This class can be used to profile different parts of the pathfinding system and the whole game as well to some extent.
Clarification of the labels shown when enabled. All memory related things profiles the whole game not just the A* Pathfinding System.
Currently allocated: memory the GC (garbage collector) says the application has allocated right now.
Peak allocated: maximum measured value of the above.
Last collect peak: the last peak of 'currently allocated'.
Allocation rate: how much the 'currently allocated' value increases per second. This value is not as reliable as you can think it is often very random probably depending on how the GC thinks this application is using memory.
Collection frequency: how often the GC is called. Again, the GC might decide it is better with many small collections or with a few large collections. So you cannot really trust this variable much.
Last collect fps: FPS during the last garbage collection, the GC will lower the fps a lot.
FPS: current FPS (not updated every frame for readability)
Lowest FPS (last x): As the label says, the lowest fps of the last x frames.
Size: Size of the path pool.
Total created: Number of paths of that type which has been created. Pooled paths are not counted twice. If this value just keeps on growing and growing without an apparent stop, you are are either not pooling any paths or you have missed to pool some path somewhere in your code.
pooling
Inner Types
Public Methods
Public Variables
Font to use.
Private/Protected Members
Handle serialization backwards compatibility.
Handle serialization backwards compatibility.